A Guide to Utilizing Data Analysis in Trading Processes
The worldwide big data analytics market was valued at $271.83 billion in 2022. This is expected to reach $745.15 billion by 2030.
This statistic alone shows that data and technology are having a monumental impact on all parts of business, society, and daily life. And, the world of trading certainly falls into this.
With more data available than ever before, using this data and analyzing it effectively has become critical for traders.

Keeping that in mind, in this blog post, we’ll reveal everything you need to know about capitalizing on data analysis to improve your trading processes.
What is data analysis?
Data analysis is the process of working with raw data; cleaning, changing, processing, and inspecting it to extract actionable and relevant information that helps you make informed decisions.
Understanding some of the ways data analysis is used in trading processes
Traders use data analysis in their processes to inform decisions, manage risk, and optimize returns.
Let’s take a look at the many different ways data analysis is used below.
Refine your trading strategy with trading database websites
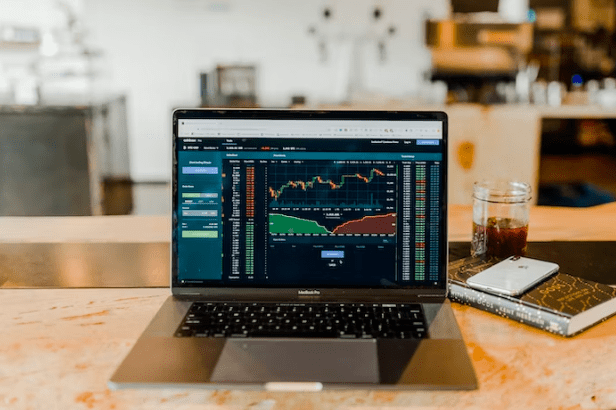
There’s only one place to begin when it comes to data analysis in trading, and this is with database platforms, such as the ETF database website.
Such tools give you the ability to access real-time market data, which you can leverage with additional features, from advanced charting to backtesting capabilities and drag-and-drop strategy builders.
This is an excellent way of refining your strategy to ensure the best possible results when trading.
Forecasting prices
One of the most common uses of data analysis is to predict future prices.
You can get a good indication of possible future price movements by using historical price data and a number of statistical methods to identify trends and patterns.
Volume analysis
Traders also analyze trading volumes – the number of shares or contracts traded in a security or market during a given period.
This data can provide insights into the strength of a particular price move and help forecast price changes.
Sentiment analysis
This form of data analysis involves the interpretation and classification of emotions (positive, negative, and neutral) within investor communications.
Traders can use this to gauge the market’s sentiment towards particular stocks or the market as a whole.
High-frequency trading (HTF)
HFT firms utilize advanced algorithms to analyze multiple markets simultaneously.
They process vast quantities of data at incredibly high speeds to make trades based on market conditions, often within fractions of a second.
Risk management
Data analysis helps traders understand and manage the risks associated with their investment portfolios.
This could involve analyzing historical market fluctuations, correlations between different assets, or the potential impact of economic events.
Optimizing your portfolio
Data analysis is used to create an optimal portfolio that maximizes returns and minimizes risk based on a given market outlook.
Techniques used may include modern portfolio theory (MPT), which uses statistical analysis to optimize the portfolio construction process.
Data discovery
When trading, it’s natural that your main concern is maximizing your profits. However, you need to factor in compliance as well.
Data compliance used to be a complicated, manual process. However, software has made it easier than ever before.
You can use data discovery tools to ensure you’re alerted about the latest privacy laws and your data is assessed so you can deal with any problem areas.
Algorithmic trading
Traders develop algorithms that execute trades when certain market conditions are met.
The algorithms use data analysis to identify these conditions and often test their strategies using historical data.
Market making
Market makers maintain a continuous presence in the markets, providing liquidity by constantly buying and selling securities.
They use data analysis to gauge market conditions and adjust their bid-ask spreads accordingly.
Arbitrage
Traders look for price differences between different markets or products using data analysis.
When they find a price discrepancy, they can buy the lower-priced product and sell it at the higher price for a profit.
Data analysis can help you battle back against account takeover, which has become a big problem in trading
Account takeover (ATO) is a significant issue in the trading world, as cybercriminals attempt to gain unauthorized access to trading accounts for illicit financial gains.
Data analysis can play a vital role in combating such an attack.
So, let’s take a look at some of the ways data analysis can help with this.
- Behavioral analysis – You can analyze patterns in a user’s behavior, such as login times, trading habits, and IP addresses. This enables you to spot anomalies that may indicate unauthorized access. If a user suddenly logs in at unusual times or from unfamiliar locations, it may be an indication of an account takeover. DataDome’s account takeover detection software is a great example of a tool that can help with this.
- Machine learning algorithms – Advanced algorithms can be trained to identify patterns associated with account takeovers. These could include a sudden increase in trading volume, rapid buying and selling of securities, or the liquidation of positions that deviate significantly from the account’s typical behavior.
- Predictive analytics – Data analysis can be used to anticipate ATOs by looking at historical data on previous attacks, identifying common elements, and using them to predict future attempts. If certain types of behavior are often associated with ATOs, predictive analytics can be used to spot them early and take preventive action.
- Fraud detection models – Data scientists can build models that analyze a variety of factors, such as transaction frequency, value, location, and many others. When the model’s output exceeds a predetermined threshold, it can trigger an alert that a potential ATO might be in progress.
- Real-time analysis – By analyzing data in real-time, organizations can identify potential ATOs as they happen. This allows for swift action, potentially stopping an account takeover before significant damage is done.
- Network analysis – Cybercriminals often target multiple accounts within the same network. Data analysis can help identify connections between accounts and flag simultaneous unusual activities, helping to prevent a broader attack.
Tips on using data analysis in trading
As you’ve seen, data analysis can give you invaluable insights as a trader. However, you must use it effectively to extract the benefits you’re looking for. So, we’re sharing some top tips to give you a helping hand.
- Choose the right tools – There are so many different software programs to choose from today. You need to find the best solution that can help you in gathering, analyzing, and interpreting data. After all, some are designed for beginners, while others are suitable for more experienced traders. You then have different tools for different types of trading. Take your time to assess the options available to you so you can narrow down your search effectively.
- Clean your data – Before you can assess data, you need to clean it. This involves getting rid of any inconsistencies or errors that could skew your results.
- Regularly review your data analysis processes – Markets are dynamic, and trading strategies that work today may not work tomorrow. Regularly review and update your data analysis processes to ensure they’re still providing you with valuable insights.
- Balance quantitative with qualitative – While data analysis is powerful, it shouldn’t be the only tool in your arsenal. Combine your quantitative analysis with qualitative research. Qualitative research includes the likes of company reports, industry news, and economic indicators, giving you a comprehensive view of the market.
- Be patient – Data analysis in trading is not about getting quick results. It’s about long-term profitability. Don’t rush into trades based on preliminary analysis; always take your time to ensure you’re making well-informed decisions.
- Avoid overfitting – When testing your trading strategy, be cautious not to ‘overfit’ your model to the past data. Overfitting involves creating a model that performs exceptionally well on the historical data but fails in real-time trading because it is too closely aligned to the specifics of the dataset.
- Manage risk – Use data analysis to better understand and manage your risk. This might involve diversifying your portfolio, setting stop-loss orders, or adjusting your position sizes based on your risk tolerance.
- Stay informed – As with all aspects of trading, you must keep learning. This is especially the case when you consider that data analysis is continually evolving. We’re seeing new techniques and tools being developed all the time. So, make sure you keep up-to-date with the latest developments so you’re making the most of your data analysis.

Enhancing the trading process with data analysis
So there you have it: some of the different ways that you can enhance the trading process with effective data analysis. From optimizing your portfolio to algorithmic trading, there are many ways that data analysis can be used to bring you greater results as a trader.
Author bio:
Kerry Leigh Harrison has over 11+ years of experience as a content writer. She graduated from university with a First Class Hons Degree in Multimedia Journalism. In her spare time, she enjoys attending sports and music events.